How to Calculate the True Cost of Manual Stock Management
· By AutoFeed Editorial · cost of manual stock management, dealership stock management costs, calculate stock management expenses, manual inventory management costs, dealership operational efficiency
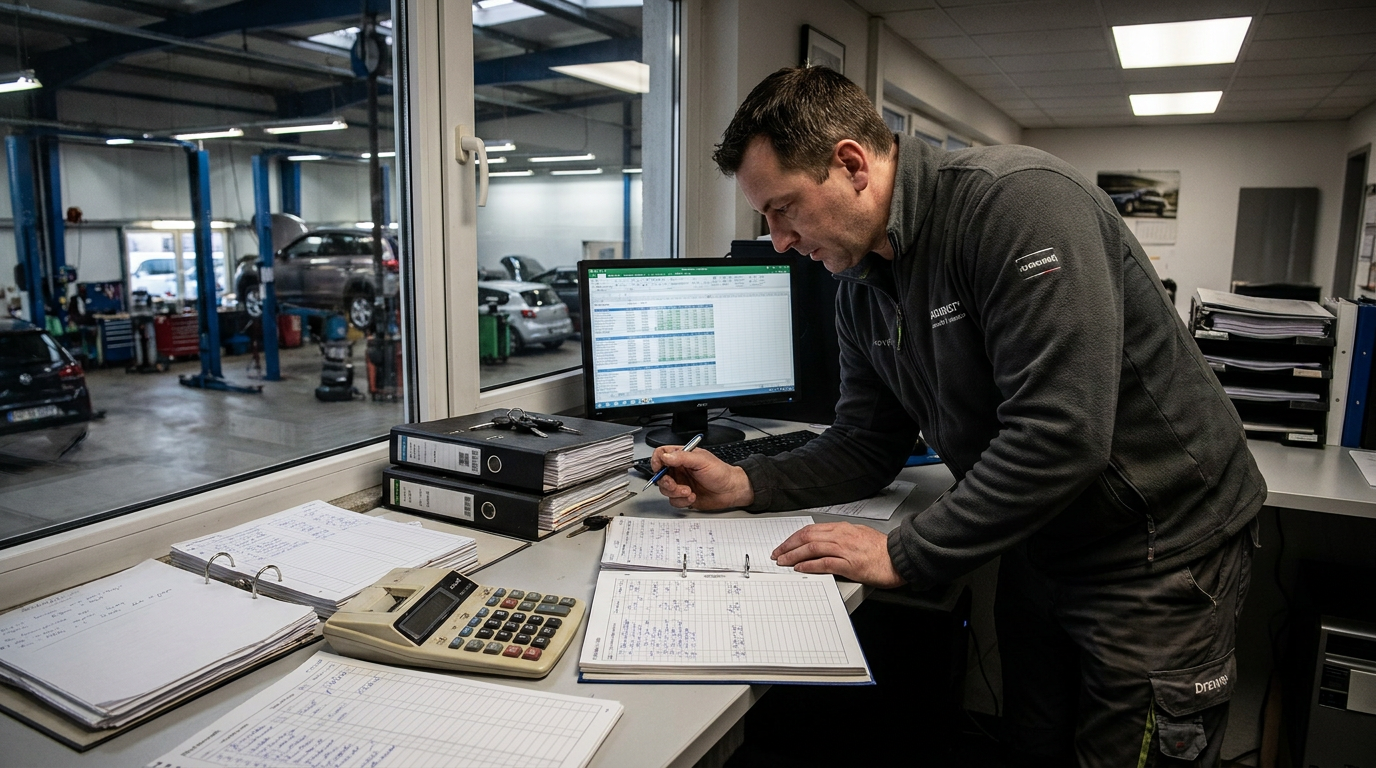
Understanding the Full Scope of Manual Stock Management Costs
The true cost of manual stock management extends far beyond the obvious labour hours spent updating listings. It encompasses direct labour costs, opportunity costs from missed sales, error-related expenses, and the compounding effect of inefficiency on business growth. Most UK dealers underestimate these costs by 40-60% because they only account for the time spent on data entry, ignoring the broader operational impact. A comprehensive calculation must include staff wages, error correction time, marketplace fees wasted on duplicate listings, lost sales from outdated inventory, and the strategic cost of delayed market response.
Many dealerships operate with incomplete visibility into how manual processes drain resources. The repetitive nature of updating vehicle listings across multiple platforms creates a hidden tax on profitability that becomes more severe as inventory grows. Understanding these costs in concrete terms is the first step towards making informed decisions about automation and operational efficiency.
Step 1: Calculate Direct Labour Costs
Direct labour costs represent the wages paid to staff members while they perform manual stock management tasks. Start by identifying every team member who touches vehicle listings, including sales staff, administrators, and managers. Track the actual time spent on stock-related activities over a typical week, including initial listing creation, price updates, status changes, photography uploads, and removing sold vehicles from marketplaces.
Multiply the total weekly hours by each person's hourly wage (including employer National Insurance contributions and pension contributions). For example, if two staff members each spend 10 hours weekly at £15 per hour (£18 with employer costs), the direct labour cost is £360 per week or £18,720 annually. This figure alone often surprises dealers who haven't formally tracked these activities.
Don't forget to include the time spent on error correction. When a vehicle appears on multiple platforms with different prices or remains listed after being sold, staff must field customer enquiries and manually correct the discrepancies. This reactive work typically adds 20-30% to the base labour cost.
Step 2: Quantify Opportunity Costs from Delayed Listings
Opportunity costs arise when vehicles sit unlisted or incompletely listed while staff work through their manual processes. Every day a vehicle isn't visible on key marketplaces represents potential lost revenue. Calculate this by determining your average days-to-sale for different vehicle types, then estimate how many additional days manual processes add before a vehicle achieves full marketplace visibility.
If your average vehicle sells for £12,000 with a £1,500 margin, and manual listing delays cost you three extra days of market exposure, you're losing potential buyer engagement during the critical early listing period when algorithms favour fresh inventory. Even a conservative estimate of one lost sale per month due to listing delays represents £18,000 in annual lost margin.
Consider also the competitive disadvantage. When competitors with automated systems list vehicles within minutes of acquisition whilst yours take hours or days, they capture early-bird buyers who actively monitor new listings. This timing gap compounds over dozens of vehicles monthly, creating a systematic competitive weakness that impacts your ability to scale.
Step 3: Assess Error-Related Costs
Errors in manual stock management create multiple cost categories. Duplicate listings waste marketplace fees, with some platforms charging per listing or per lead. Track your monthly marketplace spend, then audit for duplicate vehicle appearances. Many dealers discover they're paying for the same vehicle to appear multiple times on a single platform due to manual upload errors.
Pricing discrepancies damage customer trust and waste staff time. When a vehicle shows different prices on Auto Trader, Motors.co.uk, and your website, customers notice. Calculate the time spent handling enquiries about price differences, plus the reputational cost of appearing disorganised. Each confused customer interaction takes 10-15 minutes of staff time and may result in a lost sale.
Sold vehicles persisting on listing sites create the most damaging errors. Every call about a vehicle you've already sold wastes staff time (typically 5-10 minutes per enquiry) and frustrates potential customers who may not return. If you receive 20 such calls monthly at 8 minutes each, that's 160 minutes of wasted staff time, plus the immeasurable cost of damaged reputation. Understanding common synchronisation errors helps quantify this impact.
Step 4: Factor in Marketplace Fee Inefficiencies
Manual processes often lead to inefficient marketplace spending. Many dealers maintain active listings on platforms that generate minimal leads, simply because they lack the data visibility to make informed decisions. Review your marketplace spend against actual leads and sales generated. Calculate the cost-per-lead for each platform over three months.
Duplicate listings on paid platforms represent pure waste. If you're inadvertently paying for three separate listings of the same vehicle on a platform that charges per listing, you're tripling your costs for that vehicle's exposure. Audit your current marketplace presence to identify these duplications.
Consider also the opportunity cost of poor marketplace allocation. Money spent on underperforming platforms could be redirected to high-converting channels. If you're spending £500 monthly on a platform generating two leads whilst another platform generates 50 leads for the same spend, manual management is preventing optimal resource allocation. A strategic multi-marketplace approach requires data visibility that manual processes cannot provide.
Step 5: Calculate the Scaling Penalty
The scaling penalty represents how manual processes limit growth. As inventory increases, manual management costs don't scale linearly; they accelerate. A dealer managing 20 vehicles manually might spend 8 hours weekly, but doubling to 40 vehicles typically requires more than 16 hours because complexity and error rates increase.
Calculate your current cost-per-vehicle for stock management (total monthly labour cost divided by average inventory count). Then model what happens as you grow. If you currently manage 30 vehicles at £1,200 monthly labour cost (£40 per vehicle), growing to 60 vehicles won't cost £2,400; it typically costs £3,000-3,500 due to increased coordination complexity and error correction.
This scaling penalty creates a growth ceiling. Many dealers find they cannot profitably expand beyond 40-50 vehicles without hiring additional staff specifically for stock management. That additional salary (£20,000-25,000 annually) represents a fixed cost that automation could eliminate. The transition from manual to automated management becomes financially compelling at this inflection point.
Step 6: Account for Strategic Opportunity Costs
Strategic opportunity costs represent what your business cannot do because staff time is consumed by manual stock management. When your sales team spends 15 hours weekly updating listings, those are hours not spent on customer relationships, vehicle sourcing, or business development. Estimate the value of these alternative activities.
If a sales person could generate one additional sale monthly by spending their listing-management time on customer follow-up instead, that's £1,500 in monthly margin (£18,000 annually) that manual processes are costing you. Similarly, if management time spent coordinating stock updates could be redirected to strategic planning or supplier relationship development, there's a tangible opportunity cost.
Consider also your ability to respond to market conditions. Manual processes create lag time that prevents rapid pricing adjustments when market conditions shift or when you need to move ageing inventory quickly. This inflexibility has a cost that's difficult to quantify precisely but becomes apparent during market volatility.
Step 7: Build Your Total Cost Model
Combine all previous calculations into a comprehensive annual cost model. Your template should include direct labour costs (wages plus employer contributions), opportunity costs from delayed listings (estimated lost sales), error correction time (reactive labour), marketplace fee waste (duplicates and inefficient allocation), scaling penalties (non-linear cost growth), and strategic opportunity costs (alternative uses of staff time).
For a typical 35-vehicle dealership, this calculation often reveals total annual costs of £25,000-40,000 when all factors are included. Breaking this down to a monthly figure (£2,100-3,300) and comparing it to automation costs provides the foundation for an informed decision. Most dealers find that even accounting for only 60-70% of these costs, automation delivers positive ROI within three to six months.
Document your assumptions clearly. Use conservative estimates for opportunity costs and strategic impacts. Even a cautious calculation typically reveals that manual stock management costs 5-10 times more than dealers initially estimate when they only consider obvious labour hours.
Creating an Action Plan Based on Your Calculation
Once you've quantified the true cost, develop a phased response plan. Start by identifying the highest-cost elements. If error correction consumes significant time, prioritise solutions that improve data quality and synchronisation. If delayed listings represent the largest opportunity cost, focus on systems that enable rapid marketplace deployment.
Compare your calculated costs against automation options. At £29.99 monthly for up to 10 vehicles, AutoFeed's entry tier costs £360 annually. If your calculation reveals even £5,000 in annual manual management costs for a similar inventory size, the ROI case is straightforward. Scale this comparison to your actual inventory size and cost calculation.
Consider the implementation timeline. Most dealers can transition to automated stock management within 2-4 weeks, meaning cost savings begin accruing almost immediately. Factor in the learning curve (typically 1-2 weeks for staff to become proficient) when projecting your payback period.
Frequently Asked Questions
What's the average cost of manual stock management for a 30-vehicle dealership?
Whilst costs vary by operational structure, most 30-vehicle dealerships spend £20,000-35,000 annually on manual stock management when all factors are included. This encompasses approximately £15,000-20,000 in direct labour, £3,000-8,000 in opportunity costs from delayed listings and errors, and £2,000-7,000 in marketplace inefficiencies and scaling penalties. Dealerships that only track obvious data-entry time typically underestimate their true costs by 40-60%.
How do I calculate opportunity cost when I can't measure lost sales directly?
Use conservative proxy metrics rather than attempting precise measurement. Calculate your average margin per vehicle and days-to-sale. Estimate how many days manual processes delay full marketplace visibility (typically 1-3 days). Even assuming just one lost sale quarterly due to listing delays or errors provides a baseline opportunity cost. Track enquiries about sold vehicles or pricing discrepancies for one month to quantify error-related opportunity costs. Conservative estimates are sufficient for decision-making purposes.
Should I include management time in my cost calculation?
Yes, management time spent coordinating stock updates, resolving listing errors, and managing marketplace relationships represents a real cost. Track management hours spent on stock-related activities over two weeks, including time spent in meetings about listing issues, coordinating between staff members, and handling escalated customer enquiries about inventory discrepancies. Management time typically adds 15-25% to direct labour costs and carries a higher opportunity cost because management attention could be directed to strategic activities.
How often should I recalculate these costs?
Recalculate quarterly during your first year of tracking, then semi-annually once you have baseline data. Costs change as inventory grows, staff wages increase, and marketplace fee structures evolve. Quarterly recalculation helps you identify trends and make timely decisions about automation. If you're experiencing rapid growth, monthly tracking may be warranted because manual management costs accelerate non-linearly with inventory expansion.
What's the biggest cost component most dealers miss?
The scaling penalty and strategic opportunity costs are most commonly overlooked. Dealers track obvious data-entry time but miss how manual processes prevent growth and consume time that could generate revenue through other activities. The non-linear cost increase as inventory grows (managing 40 vehicles costs more than twice as much as managing 20) surprises most dealers. Similarly, the value of redirecting 15 hours of weekly staff time from listing updates to customer relationship development represents a substantial opportunity cost that rarely appears in initial estimates.
What's the average cost of manual stock management for a 30-vehicle dealership?
Whilst costs vary by operational structure, most 30-vehicle dealerships spend £20,000-35,000 annually on manual stock management when all factors are included. This encompasses approximately £15,000-20,000 in direct labour, £3,000-8,000 in opportunity costs from delayed listings and errors, and £2,000-7,000 in marketplace inefficiencies and scaling penalties. Dealerships that only track obvious data-entry time typically underestimate their true costs by 40-60%.
How do I calculate opportunity cost when I can't measure lost sales directly?
Use conservative proxy metrics rather than attempting precise measurement. Calculate your average margin per vehicle and days-to-sale. Estimate how many days manual processes delay full marketplace visibility (typically 1-3 days). Even assuming just one lost sale quarterly due to listing delays or errors provides a baseline opportunity cost. Track enquiries about sold vehicles or pricing discrepancies for one month to quantify error-related opportunity costs. Conservative estimates are sufficient for decision-making purposes.
Should I include management time in my cost calculation?
Yes, management time spent coordinating stock updates, resolving listing errors, and managing marketplace relationships represents a real cost. Track management hours spent on stock-related activities over two weeks, including time spent in meetings about listing issues, coordinating between staff members, and handling escalated customer enquiries about inventory discrepancies. Management time typically adds 15-25% to direct labour costs and carries a higher opportunity cost because management attention could be directed to strategic activities.
How often should I recalculate these costs?
Recalculate quarterly during your first year of tracking, then semi-annually once you have baseline data. Costs change as inventory grows, staff wages increase, and marketplace fee structures evolve. Quarterly recalculation helps you identify trends and make timely decisions about automation. If you're experiencing rapid growth, monthly tracking may be warranted because manual management costs accelerate non-linearly with inventory expansion.
What's the biggest cost component most dealers miss?
The scaling penalty and strategic opportunity costs are most commonly overlooked. Dealers track obvious data-entry time but miss how manual processes prevent growth and consume time that could generate revenue through other activities. The non-linear cost increase as inventory grows (managing 40 vehicles costs more than twice as much as managing 20) surprises most dealers. Similarly, the value of redirecting 15 hours of weekly staff time from listing updates to customer relationship development represents a substantial opportunity cost that rarely appears in initial estimates.